
Climate Risk - getting down to the bottom line


We are proud to announce that Envai is introducing a series of climate risks products! While we have previously focused on the effect of corporations on the environment through our emissions and Climate Pathway products, one cannot fully quantify the environmental risk facing any organization without also considering the effect of the environment on corporations. While the former focuses on ESG mandates and transition risk, the latter is crucial to understanding the impacts of a changing climate to the bottom line costs and survival of any company — no matter how green the company is.
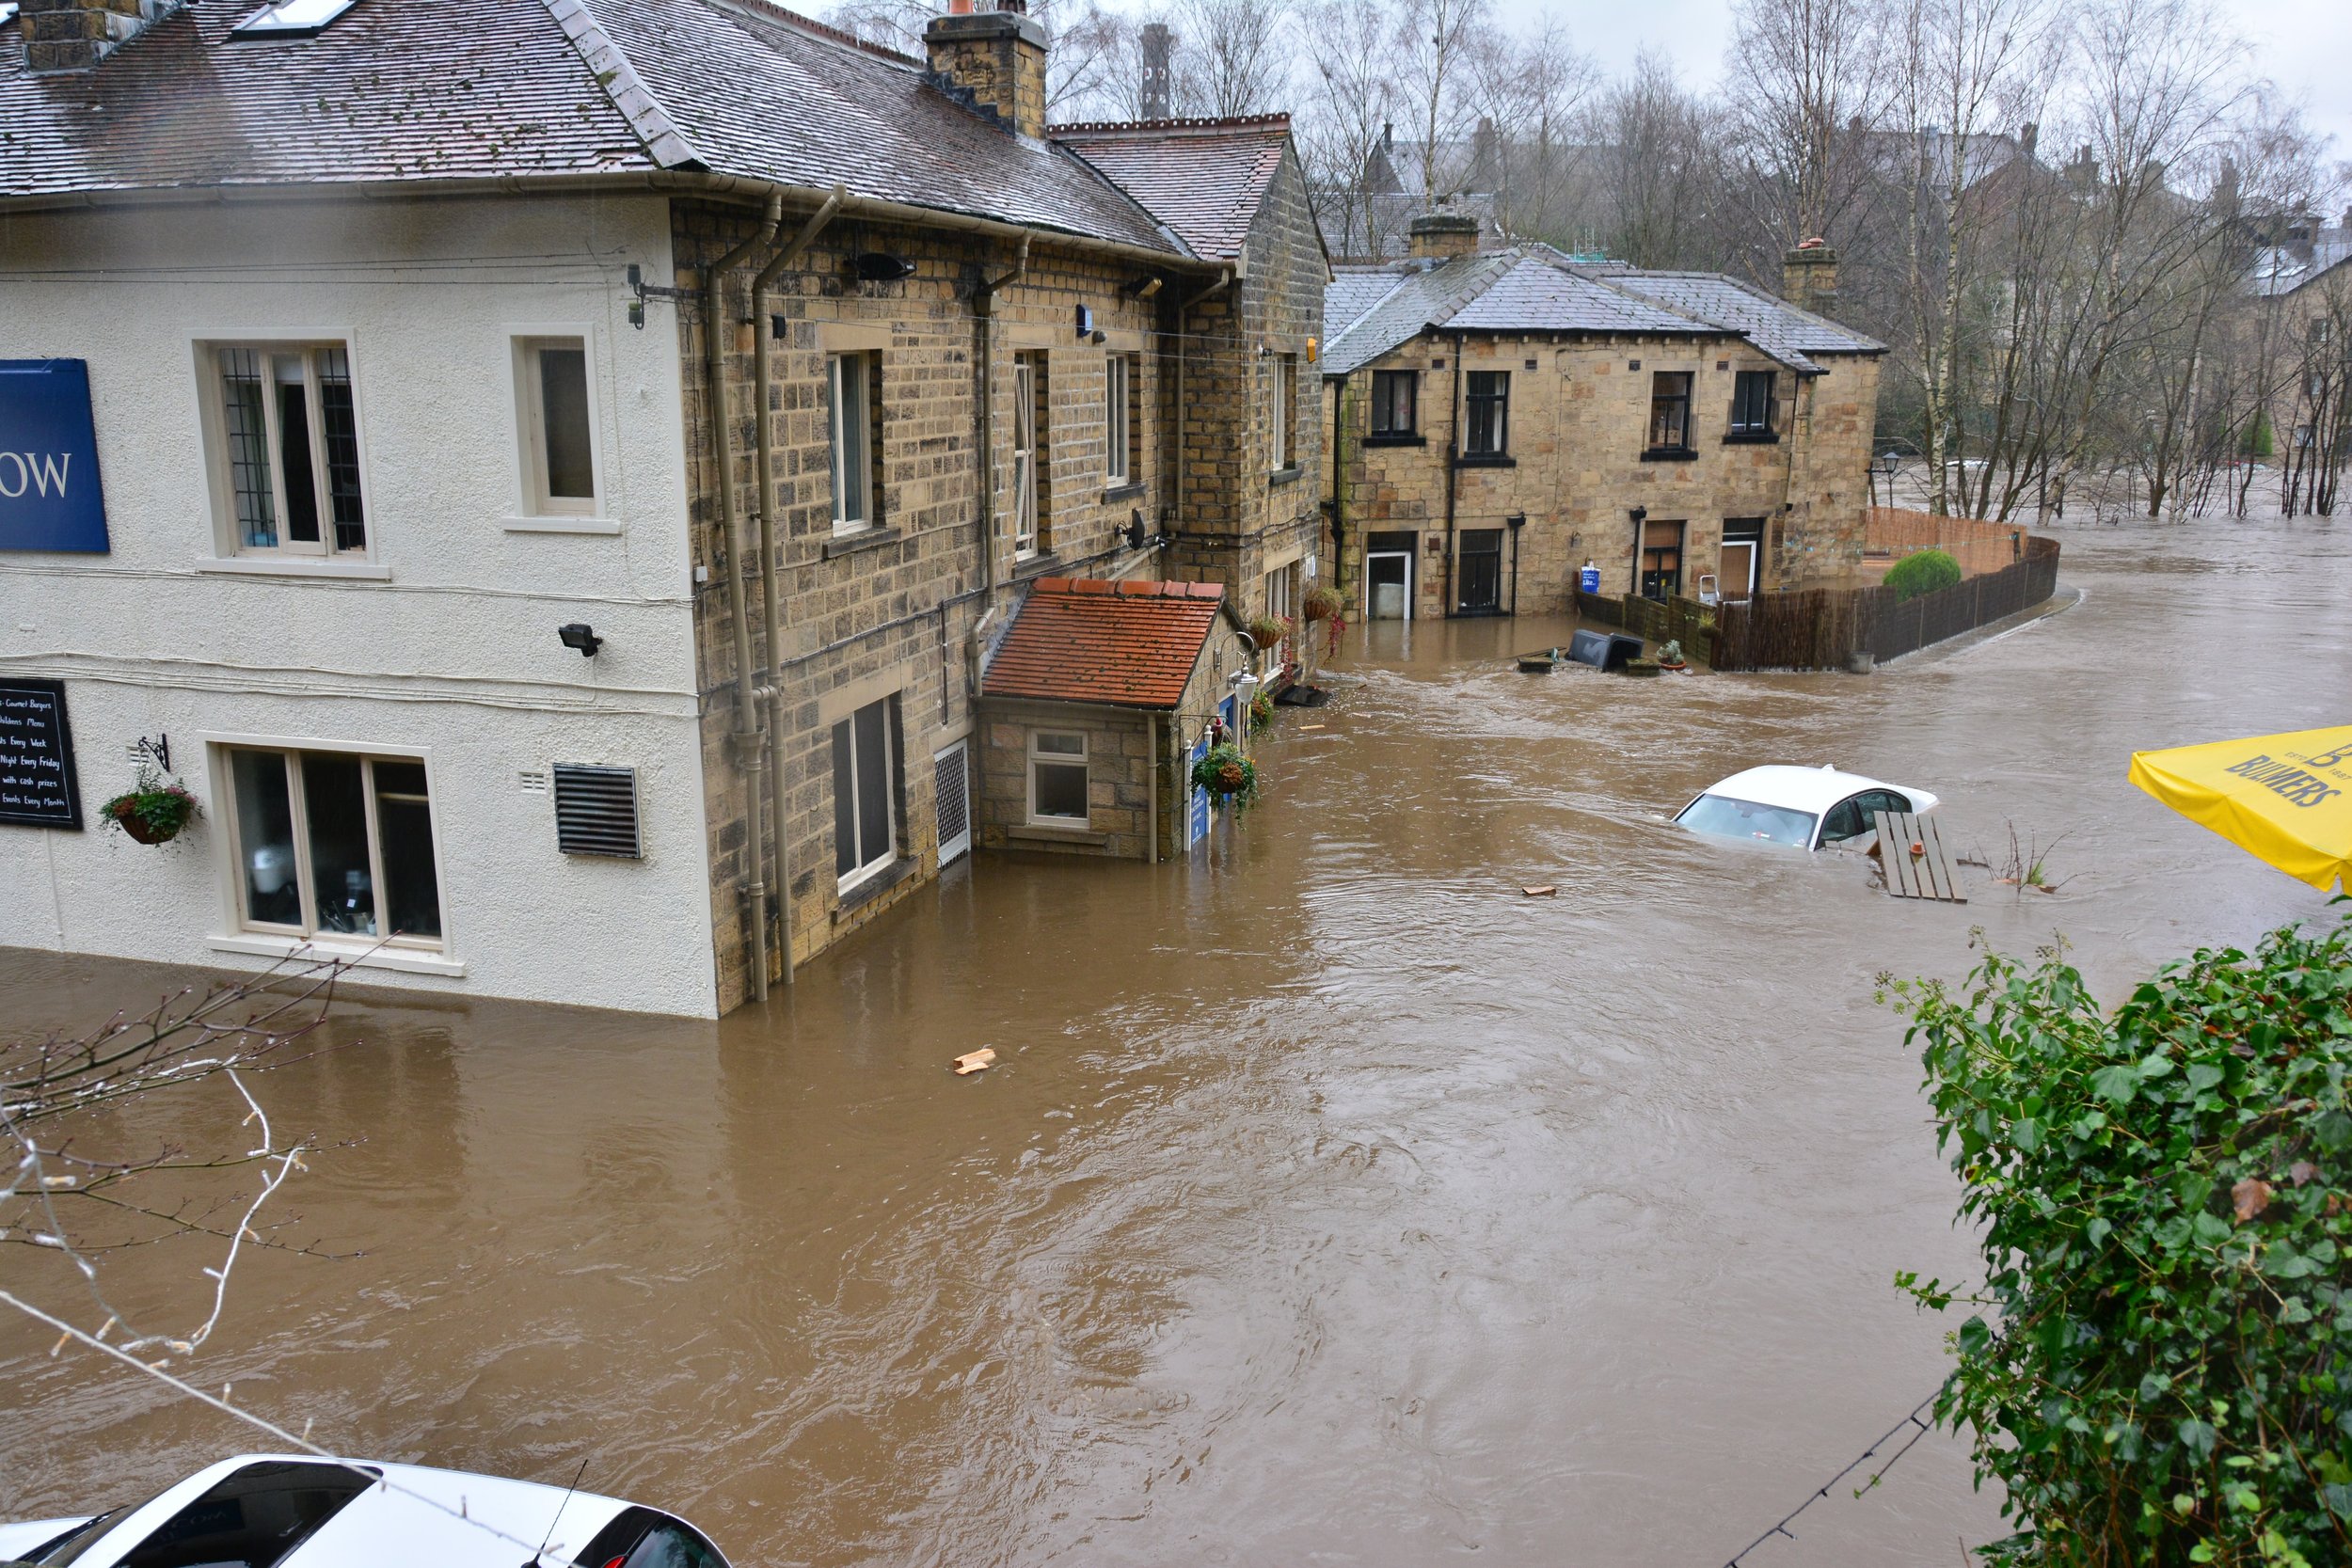
As a result, we are introducing our state-of-the-art climate risks products, initially focusing on flooding, sea level rise, and wildfires. As is already evident in 2022, these factors are continually challenging existing risk models and touch every aspect of business in the twenty-first century.
Given the expertise of our team, this is a natural next step in the growth of Envai. Dr. Mohajerani, the co-founder and CEO of Envai, received his PhD in Earth System Science at UC Irvine, focusing on glacier mass balance and sea level rise using satellite remote sensing, climate models, and machine learning (learn more here). Our CTO, Tharshi Srikannathasan has extensive research and operational experience in atmospheric science, focusing on the novel modeling and tracking of climate change related phenomena including extreme temperature and precipitation.
Sneak Preview: Flooding in Ontario
Thunder Bay, Ontario, Canada
Let’s take the case of Thunder Bay, Ontario. Thunder Bay has an elevation of about 186 meters by the coast. Now what would happen if there was a water surge of a few meters?
Using our exact topography model, along with the network of roads and highways, we can simulate the movement of water over time!
The water levels start to accumulate from the low-lying areas, and gradually flood areas up the coast as the flooding continues.
Now, while this scenario is not very likely, by combining these flood models with our trusted climate models and forecasts, we can provide a whole new layer of analysis for our clients. This allows them to examine physical risk — such as floods — at a high level of granularity and plan accordingly.
These analyses extend to various causes of floods, such as rain, storm surges, tidal floods, and riverine floods. Each component has a long history of analysis and modeling, which we incorporate into a central tool for analysis by our clients.
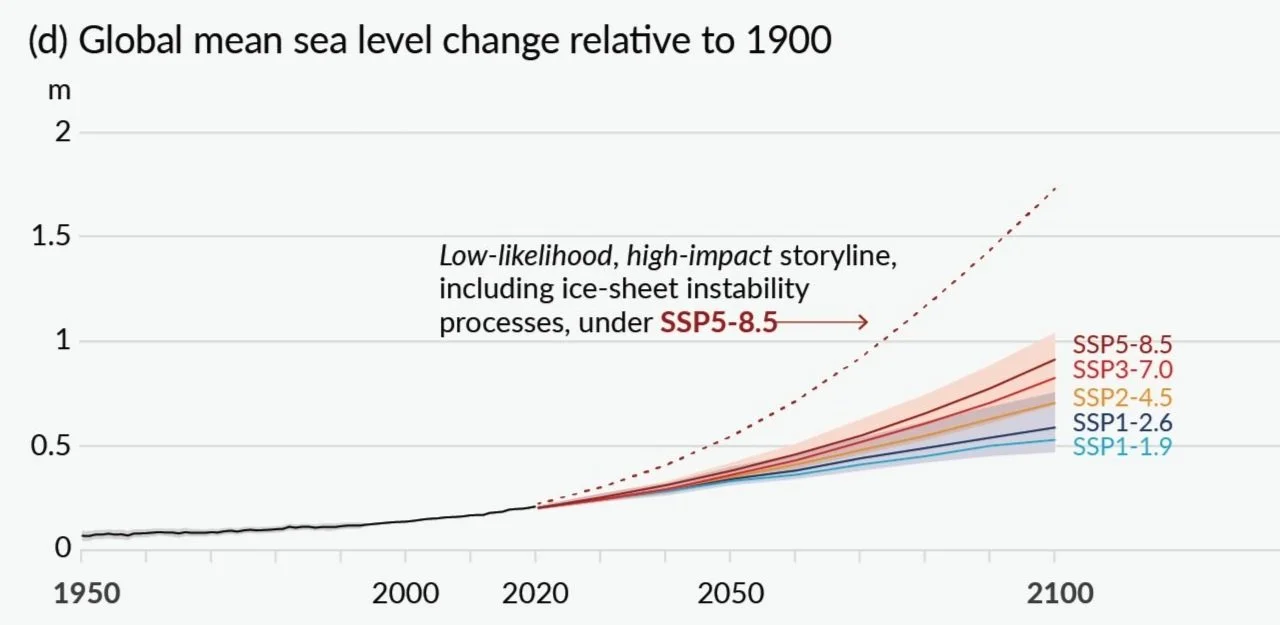
For example, detailed reports of global sea level rise trends, compiled from a large number of state-of-the-art studies, as reported by the IPCC can be integrated into our models to provide different probabilities for extreme events in this century.
Going from Climate Models to Dollars

As impressive as climate metrics — in degrees and meters and liters — by themselves may be, they don’t help companies understand the bottom line impact of environmental hazard on their businesses. That is why we go even further, and combine our state-of-the-art environmental outputs with actuarial modeling to help our clients understand the financial cost of environmental hazards. This is not a one-size-fits all solution. As such, we provide our customers with the capability to outline their operations, with the associated geographical coordinates, and we will do the rest!
By combining our climate, risk, and actuarial models, we help corporations and investors tackle all aspects of environmental analysis — from mandates to transition risk to physical risk — at an unprecedented level of granularity and control. If you don’t want to be blindsided by a changing world, make sure to reach out to us to learn more!

Contact us to learn more about our risk products!

Climate Pathways: How we calculate temperature scores

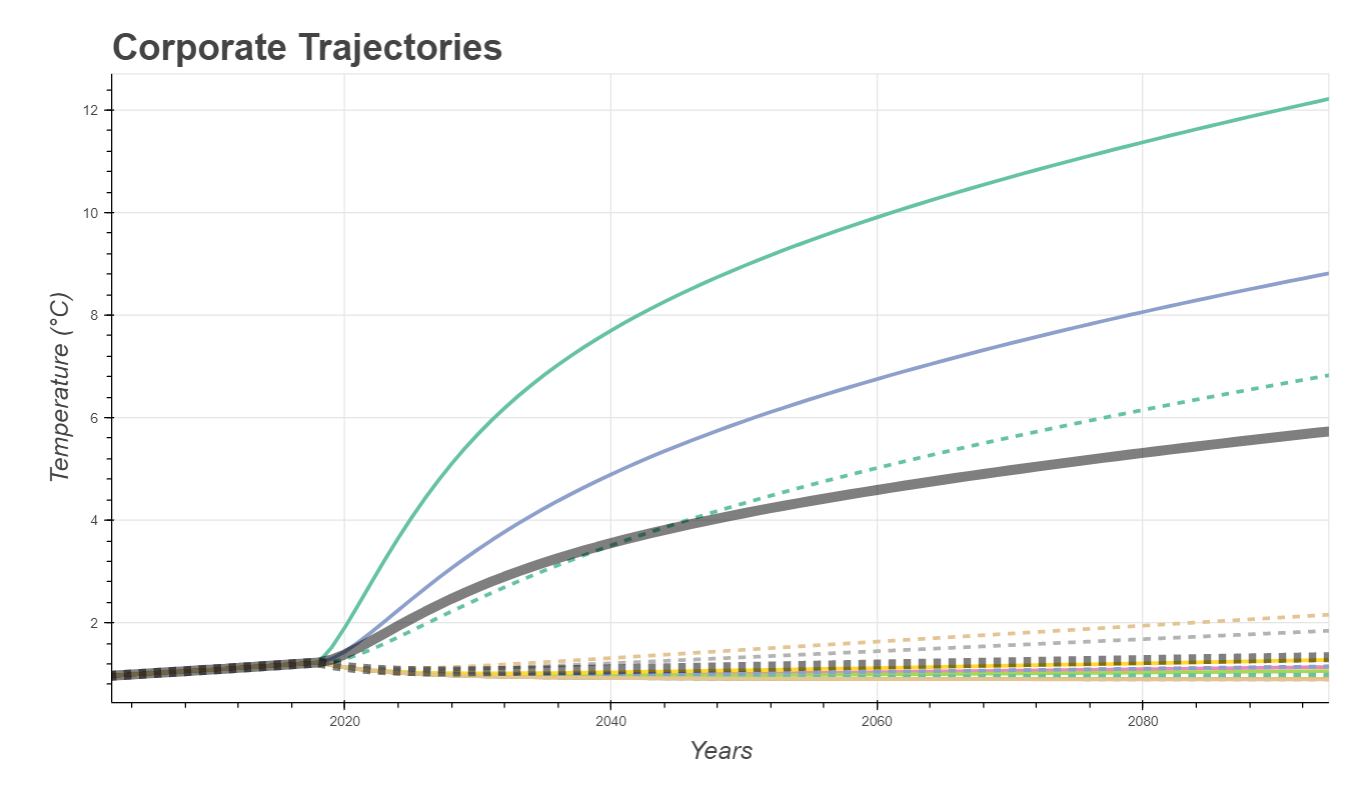
Our Climate Pathway API provides the ultimate climate calculator for anyone optimizing the climate impact of their investments and activities. By scaling the practices of each corporation we provide the bottom line environmental impact of corporations under any number of assumptions and scenarios such as their current emissions, their stated targets, or how you think they are going to evolve in the future.
But how does it work?
We take a simple approach: The goal is to scale the emissions of each corporation to see what global emissions would be if everyone behaved similarly to the given company. The best way to do this is to scale the emissions of each corporation according to its size.
Let’s assume the company has a total of 1 million metric tonnes of CO2eq across scopes 1, 2 and 3 emissions. While operating and emitting (including up and down the supply chain), the company made $1 billion in revenue. Now, with the global GDP being ~91 trillion as of 2021, this company represents 0.001% of the global economy. That means, if everyone had the impact of this company, the annual global emissions would be 91 billion metric tonnes of CO2eq. That’s not great, given the current actual annual emissions are about 35 billion metric tonnes! So this company certainly belongs to a climate scenario that has higher temperatures by the end of the century.
To find out exactly how much, we use our climate models. Given the total amount of greenhouse gas forcing in this scenario we run our climate model forward to the end of the century to get the trajectory of temperature rise, sea level rise, and even biodiversity loss.
But what if Scope 3 data is not available?
Many corporations still do not report their scope 3 emissions — emissions from up and down the supply chain, as well as those of investments, franchises, travel and commute, and other categories. Let’s say our company above has a total scope 1 and 2 emission of 10,000 metric tonnes CO2eq. These correspond to the direct emissions of the company, as well as indirect emissions from the energy usage of the company, such as the electricity it draws from the grid, but not those of the supply chain. As such, the corresponding measure of the size of the company should be a measure of the value the company generates, without including the cost of everything up the supply chain. A good proxy for this is the gross profits of the company. If you are buying a phone, you are indirectly paying for all the raw materials that went into it, the mining and processing of precious metals, and everything else. A product that is way down the supply chain has to include all the upstream costs into the selling price. Thus, revenue implicitly takes the supply chain into account. But gross profit represents how much the company earns after all the costs have been removed. So if the emissions from scopes 1 and 2 led to $100 million gross profit, the company represents 0.0001% of the global economy. The equivalent global forcing in this case would be 9.1 billion metric tonnes of CO2eq - an order of magnitude lower than the forcing when taking the whole supply chain into account.
We provide the pathways for both scope 1+2 and scope 1+2+3. It’s noteworthy to point out that using revenue to represent the value of the whole supply chain can be a good proxy when dealing with companies that have most of their scope 3 emissions before them up the supply chain. However, when dealing with companies that operate near the top of the chain (such as mining or oil and gas companies), this proxy does not take into account the value that is added below them.
While this approach provides a baseline for evaluating corporations across all industries, we are working on industry-specific metrics to take more nuanced details into account within the supply chain in each vertical. So make sure to stay tuned!
One last thing… I understand the scaling of emissions — but why should I trust your climate models?
The good news is that it is a lot more straightforward to benchmark our physical climate models. We can simply run the climate model forward in time under various forcing scenarios, and compare the results with those of established models. We have previously shown that our climate model is able to closely replicate the results of the 30 CMIP5 (Coupled Model Intercomparison Project Phase 5) models that are used in the IPCC report. A quick look at the results under various RCP (Representative Concentration Pathways) forcing scenarios shows this agreement, which is not just in the range of all models, but is in fact in close agreement with the mean:
| RCP Scenario | IPCC 2081-2100 Mean Temperature (oC) | IPCC 2081-2100 Temperature Range (oC) | EnvAI's 2081-2100 Mean Temperature (oC) |
|---|---|---|---|
| RCP 2.6 | 1.0 | 0.3 - 1.7 | 0.8 |
| RCP 4.5 | 1.8 | 1.1 - 2.6 | 1.5 |
| RCP 6.0 | 2.2 | 1.4 - 3.1 | 2.0 |
| RCP 8.5 | 3.7 | 2.6 - 4.8 | 3.2 |
If you have questions regarding our methodology, or want to have a chat, do not hesitate to reach out!

Contact us to learn more about the Climate Pathways and get access to the API!

Announcing EnvAI Academic Program
We are proud to announce the EnvAI academic program, where academic institutions can freely access our data and Climate Pathway API for non-commercial research purposes.

While academic licenses do not provide access to the entirety of our products, they are issued on a case-by-case basis to provide researchers with a convenient API access point for corporate or sector level climate data. Researchers can access our computational engine to assess the climate pathway of corporations based on any number of underlying assumptions such as future climate action or corporate policy.
EnvAI is committed to open-science and the continued support of collaborative research that tackles the most pressing issues of our time. With our co-founders having come from academic backgrounds, we value and support fundamental research at all levels.
Researchers are encouraged to reach out to us directly for access to the EnvAI Climate Pathway API.

Get Access

Embedding climate data into Financial Algorithms
Why algorithmic climate data is integral to modern portfolio optimization

Responsible investing is increasingly gaining momentum as public, government, and shareholder pressure increases around Environmental, Social, and Governance (ESG) issues. In fact, recent data shows that one out of every three funds is now labelled as an ESG fund. But how do these responsible investment funds compare with their more traditional counterparts?
A recent meta-analysis by McKinsey analyzed 2000 individual studies that examined the financial gains of ESG-driven funds. 63% of these studies found that these funds resulted in positive financial gains. However, 8% of studies found negative results, showing a compromise between responsible investing and financial returns. In fact, a recent OECD (Organisation for Economic Co-operation and Development) report found large variations in the financial returns of sustainable funds. An analysis of the highest rated ESG funds showed 5-year annualized financial returns ranging from -20% to more than 20%.
These variations have huge financial consequences for the financial sector, as institutions are faced with the dual pressures of responsible investment and financial returns. In fact, with ESG assets projected to reach $53 trillion by 2025, a loss of 20% translates to $10.6 trillion globally!
The large variation in the financial returns of sustainable funds can be largely attributed to lack of algorithmic ESG data as financial institutions move from a single-metric regime to one of multi-dimensional portfolio optimization. Environmental data and ratings are still largely qualitative. Even where quantitative data does exist, lack of algorithmic scenario-building and experimentation tools present barriers for simultaneous optimization of portfolios across financial and climate metrics. optimization. EnvAI’s Climate Pathway API solves this problem by placing environmental data on an equal footing with traditional financial data.
As a case study, we sampled 132 companies across a variety of sectors including healthcare, utilities, energy, finance, technology, and others. With a total investment amount of $1 million, we simulated 10,000 portfolios by distributing the fixed total amount of money randomly across the different company stocks. The returns on equity of the portfolios are plotted against the end of century temperature associated with each portfolio below:
As expected, there is large variation in both the economic returns and the climate pathway of the funds. What’s interesting, however, is the relationship between the two. There is a large spread of climate pathways as indicated by end-of-century temperature scenarios across all financial returns. At the same ROE of 1%, portfolios can range in their climate pathway from less than 1 °C to 7+ °C. Similarly, funds that are compliant with a < 1 °C warming pathway can have ROEs ranging from -7% to 2%.
Using the computational engine provided by the EnvAI Climate Pathway API, asset managers can systematically analyze the full space of climate impact vs. financial returns using any number of equities, sectors, and emission assumptions.
But why not optimize funds based on total emissions?
Many financial institutions have pledged to emission-based targets, such as the large number of banks who have signed onto the Net-Zero Banking Alliance. However, not only are these targets based on far-off and hard-to-achieve binary targets (i.e. no target or a zero-emission target), they do not reflect the underlying desired climate pathways such as those of the Paris Agreement. But more importantly, net-zero emission goals do not allow for continuous and algorithmic optimization of investments based on meaningful metrics that relate to the underlying climate mandates.
As an example, take two corporations: Company A and Company B. Company A is a trillion-dollar multinational corporation that produces goods for a sizeable portion of the population. Company B, on the other hand, is a medium-size domestic company. Due to exceptionally poor environmental practices, company B has the same emissions as company A, while producing a fraction of the output. Using total carbon emissions, company A and company B would contribute equally to the environmental footprint of a portfolio. However, it is clear that these two corporations belong to vastly different climate scenarios. Company A represents a world where the demands of billions of people are met with the emissions of a medium-sized domestic company, whereas company B represents a world with a highly unsustainable pathway.
To illustrate the difference between raw emission numbers and the underlying climate scenarios, we plot the end-of-century temperatures of the 132 companies from the example above against the total emissions for each portfolio.
While there is an overall positive correlation between emissions and temperatures, as expected, it is clear that one can mistakenly minimize the total emissions of a fund while remaining on a very warm climate pathway on the upper left corner of the plot. On the other hand, it is also possible to remain on a relatively sustainable climate pathway without having the smallest possible emissions. In other words, simply minimizing total emissions is not always the correct metric in minimizing the environmental footprint of a fund if the goal is to be compliant with climate targets such as those of the Paris Agreement.
By providing the underlying climate pathway of funds through a customizable computational engine provided by the EnvAI Climate Pathway API, investors and asset managers can increase financial gains while keeping their portfolios compliant with the real environmental metrics that correspond to overarching climate goals. Learn more about our Climate Pathway API here. To learn more about the product and request a demo, get in touch with us below!

Contact us to learn more about EnvAI’s Climate Pathway API!

Climate Pathway Case Studies: Aviation and Shipping
EnvAI’s Climate Pathway API provides the most direct way for investors to align their portfolios with concrete climate mandates. By bringing geoscience to the realm of financial analytics, we enable quantitative decision making that simultaneously optimizes for financial and climate goals. In this post, we benchmark our models against independent data at the sector level. While the Climate Pathway API provides temperature pathways at the corporate level, benchmarking studies at the sector level allows for direct comparisons with existing data.
Case Study 1: Aviation
As a case study, we compare our climate projections for the international aviation sector with independent estimates to gauge the performance of our models. The Climate Action Tracker (CAT) outlines the projected and targeted climate impacts of the aviation sector. Given the historical and projected emissions of the sector based on current policies, CAT projects a climate pathway of 4+ °C by the year 2050. On the other hand, targeted emissions should result in a <2 °C world.
We independently run the total emissions resulting from freight and passenger flights through the EnvAI Climate Pathway analysis pipeline. The results are summarized below:
Comparison data retrieved from Climate Action Tracker: Climate Action Tracker (2021), International Shipping/Aviation Assessment - July 2021 Release -http://climateactiontracker.org. Copyright © 2021 Climate Action Tracker by Climate Analytics and NewClimate Institute. All rights reserved.
Our models indicate a lower bound of 3.9 °C and an upper bound of 4.3 °C by 2050 given projections based on existing policies, with a mean of 4.1 °C. This is in excellent agreement with the CAT climate projection of 4+ °C.
In addition, by implementing the emission target goals of the sector, we obtain temperature pathways leading to a lower bound of 1.3 °C and an upper bound of 1.4°C by 2030, and corresponding values of 1.9 °C and 2.2 °C by 2050. The CAT projections based on target emissions indicate a <2 °C pathway in the 2030s, which is in agreement with our projections.
Case Study 2: Shipping
Global shipping makes up 2 to 3 percent of global carbon emissions. With that number projected to grow to as much as 17%, shipping (both freight and passenger) is a key player in global greenhouse gas emissions. In this case study, we compare the EnvAI Climate Pathways for the international shipping industry to those of the Climate Action Tracker.
CAT provides industry-wide emissions for international shipping since 1990 to present, as well as projected emissions to 2050 based on existing policies. CAT temperature projections place the industry between the Highly Inefficient (< 4 °C) and Critically Insufficient (4+ °C) pathways.
In addition, with an industry goal of 499 to 568 MtCO2-equivalent per year of emissions, CAT places the industry on a targeted temperature pathway of Insufficient (between 2 to 3 °C).
The figure below illustrates the EnvAI pathways based on policy projections (red) and target emissions (blue).
Comparison data retrieved from Climate Action Tracker: Climate Action Tracker (2021), International Shipping Assessment - July 2021 Release -http://climateactiontracker.org. Copyright © 2021 Climate Action Tracker by Climate Analytics and NewClimate Institute. All rights reserved.
We find a climate pathway leading to 3.8 °C by 2050 based on current policy projections, and a pathway leading to 2.4 °C based on industry targets. As shown, our projections fall well within the CAT estimates at the sector level.
The case-studies here are just some examples of how the EnvAI Climate Pathway API compares with independent data. While our API provides insights at the level of individual corporations, aggregated sector-wide analyses provide a robust framework for comparability of results. We see that our climate pathways are well in agreement with the Climate Action Tracker projections for the aviation and shipping industries.
EnvAI’s Climate Pathway API provides actionable climate data for financial institutions by bridging the gap between geoscience and financial analytics and bringing environmental data on an equal footing with traditional data. Learn more about our Climate Pathway API here. To learn more about the product and request a demo, get in touch with us below!

Contact us to learn more about EnvAI’s Climate Pathway API!
Introducing EnvAI’s Climate Pathway API

Financial institutions are increasingly pledging to align themselves with concrete climate goals such as the Paris Agreement 1.5°C warming target. Within the last year, 450 banks committed themselves to the agreement, with an increasing number of organizations joining the pledge.
However, while there are numerous platforms for individual corporations to report their emissions and environmental performance, financial institutions have an entirely different challenge:
Given the myriad of ESG data reports, how do institutions bridge the scientific gap between raw data and interpretable climate pathways that are comparable with targets such as the Paris Agreement?
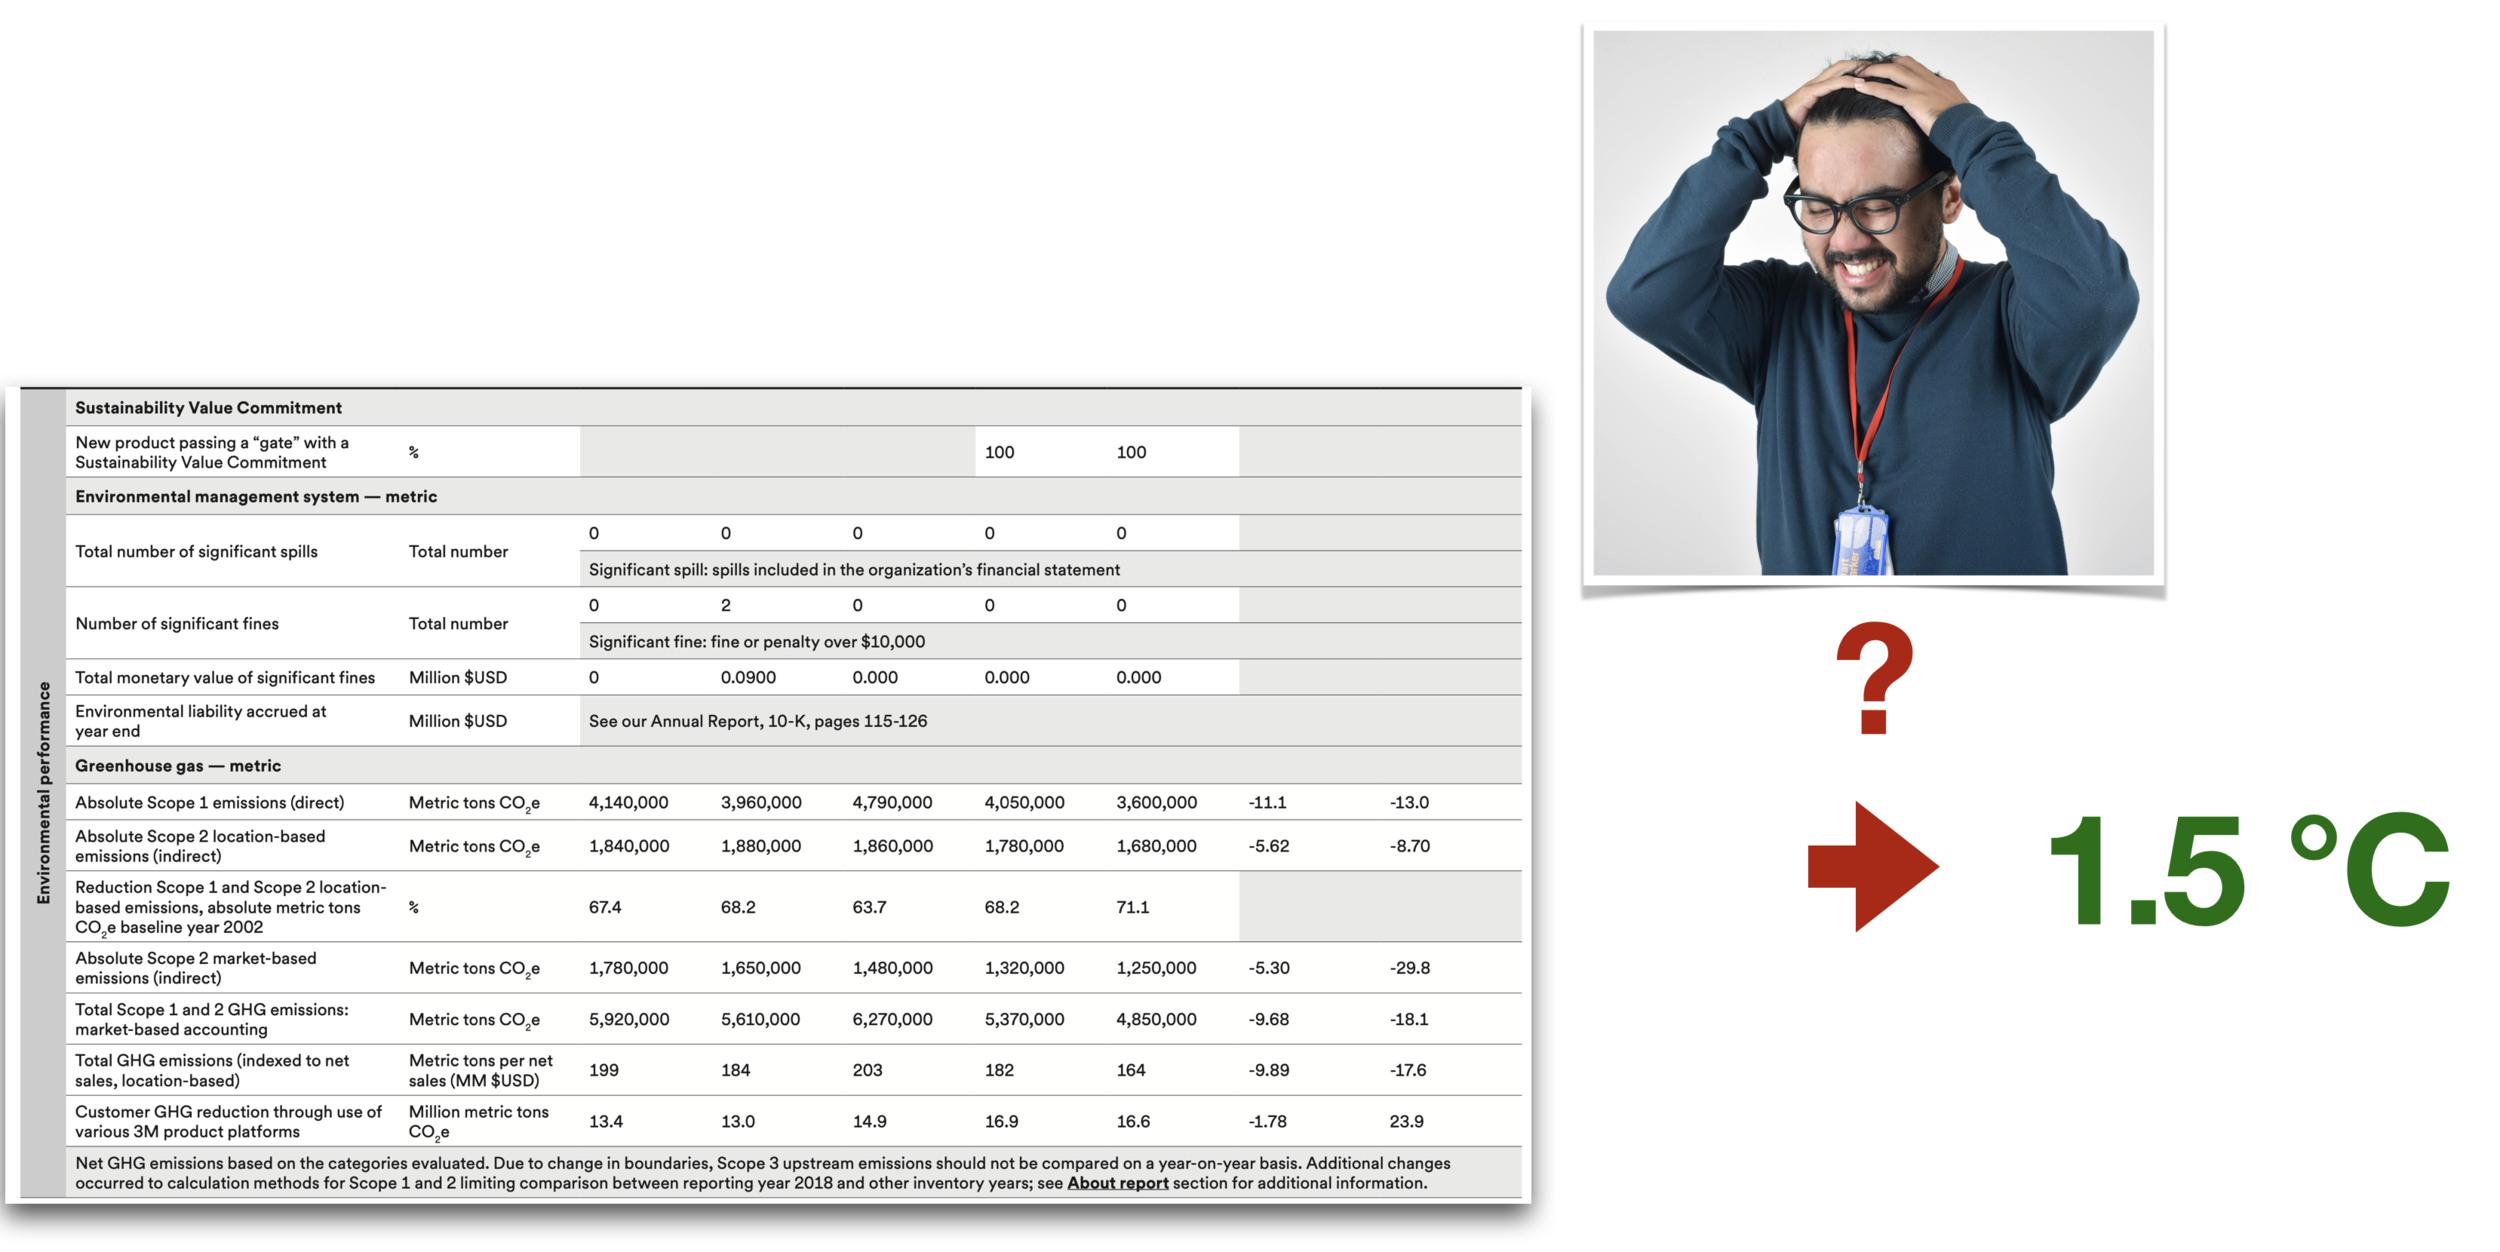
While ESG reporting has been evolving in the past few years, there is still no easy way for financial institutions to bridge the gap from the raw data to interpretable climate pathways. Sample emission report taken from 3M’s public sustainability report.
The need for a new perspective on ESG, based on real climate pathways, is further demonstrated by the new report by the Carbon Disclosure Project (CDP) and World Wildlife Fund (WWF) that translates the future emission reduction targets (not real emission data) of companies into temperature pathways. This provides a concrete framework for assessing self-imposed company emission targets. The CDP/WWF methodology uses a regression model and a series of pre-computed climate scenarios based on the assumption that there is a linear relationship between company target metrics and the global temperature in 2100 (more details on the methodology found here).
Our Climate Pathway API uses real climate models based on trusted and rigorous science to fully model the climate pathway of a company based on its actual present-day environmental impact. We believe that evaluating companies is most meaningful when it based on real performance data, and not self-imposed targets for decades in the future.
How Reliable are EnvAI’s core climate models?
We use trusted climate models to project the temperature pathway of companies. Our models are vetted and use state-of-the-art climate science to run century-wide projections. As a reference point, we replicate the Representative Concentration Pathways (RCPs) as reported by The Intergovernmental Panel on Climate Change (IPCC). The historical and projected emissions for each scenario are provided publicly by the Potsdam Institute for Climate Impact Research, which are shown below:
The bottom panel shows the corresponding temperature pathways that are reproduced by our model from the emission scenarios. Our temperature projections for the end of the century are compared with the mean of more than 30 different models in the the CMIP5 ensemble (Coupled Model Intercomparison Project Phase 5) reported in the IPCC below:
| RCP Scenario | IPCC 2081-2100 Mean Temperature (oC) | IPCC 2081-2100 Temperature Range (oC) | EnvAI's 2081-2100 Mean Temperature (oC) |
|---|---|---|---|
| RCP 2.6 | 1.0 | 0.3 - 1.7 | 0.8 |
| RCP 4.5 | 1.8 | 1.1 - 2.6 | 1.5 |
| RCP 6.0 | 2.2 | 1.4 - 3.1 | 2.0 |
| RCP 8.5 | 3.7 | 2.6 - 4.8 | 3.2 |
The 2081-2100 temperatures are reported relative to the mean of 1986–2005 temperatures. It is clear that our projections are in close agreement with mean of more than 30 climate models reported in the IPCC.
How does this relate to corporate action?
Having shown a successful projection of temperature scenarios at a global level, we asked ourselves if we can help clarify the bottom-line of corporate climate mandates by translating real corporate practices to climate pathways that are directly comparable to established mandates such as the Paris Agreement. Today we are happy to provide that service through the EnvAI Climate Pathway API. We accomplish this by fusing aggregated corporate sustainability data with remotely-sensed insights and trusted climate models in our proprietary computational engine.
By using EnvAI’s Climate Pathway API, analysts can create rigorous hypothetical futures based on the climate pathway of the companies. This makes it easier than ever to assess the environmental impact of corporations without the need to digest indirect ESG data such as company emissions reported across a range of scopes and standards.
As an example, clients can define their model configurations such as emission reduction timespans and magnitudes, thus projecting current company practices into the future without only relying on self-proclaimed emission goals from companies.
The Bottom Line
Our climate pathways provide a more direct and standardized way of assessing the environmental footprint of corporations within the framework of actual climate trajectories. While most companies have mandates such as the Paris Agreement, the currently available data on the market is mostly in terms of qualitative rankings or absolute emissions. We assess the footprint of corporations based on scaled practices, so that they are directly comparable with temperature-based mandates.
Contact us to learn more about EnvAI’s Climate Pathway API!